Household Debt in Singapore – Trends and Causes Analyzed

By Value Penguin
In our study of household debt in Singapore, we’ve explored household debt trends in Singapore. One key finding of our study was that household debt is growing dramatically as a percent of household assets. Such trend was especially true for personal loans and credit card debt, which now account for over 22% of total household liabilities in Singapore, up from 16% in 2007.
Household debt in Singapore has been called as one of the biggest issues facing economic growth in the years to come. Why is household debt rising in Singapore, and what does this mean for economic growth moving forward?
Growing Consumer Debt
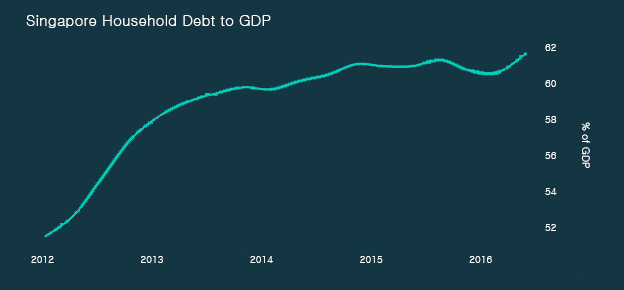
In the 2nd quarter of 2016, household debt reached a record 61.1% of GDP in Singapore. This is to say that Singapore citizens hold a combined S$61 in debt for every S$100 the Singapore economy produces each year. This is significant, as the household debt to GDP ratio was just 45% in 2010. At 61.1%, Singapore’s current household debt to GDP ratio is lower than the United States (78.8%) yet higher than is currently found in the Euro Zone (58.9%) or China (41.85%). The primary concern for economists is the rate of growth in household debt that Singapore has experienced over the last five years.
A simple reason for this growth in household debt, is the exceptionally low cost of debt. Central banks across Southeast Asia have driven interest rates to all-time-lows following the 2008 financial crises. As a result, individuals and businesses have had the incentive to take on new debt for cars, homes and student loans. This is a huge concern especially in face of rising interest rates. As rates rise, interest payment on these loans become increasingly more difficult to service, which could lead to reduced disposable income and possibly bankruptcies for some consumers.
Why Household Debt Matters
Most consumers understand that having more debt, relative to assets, can be a problem. In finance, we say an individual or business is “over-leveraged” when debt obligations become unmanageable and payment becomes a problem. As individuals become over-leveraged, it can become harder and harder to pay down their existing debt obligations as monthly interest payments continue to increase.
Singaporean households are more levered than their counterparts in the US or Korea, with asset to equity ratio reaching 120% for Singaporean households compared to 80-90% for US and Korea. The discrepancy between household debt to GDP ratio and leverage ratio is likely due to the fact that government sector accounts for a bigger proportion of Singapore’s economy, and suggests that Singaporeans are just as burdened (if not more) by debt as their counterparts abroad.
| Singapore | US | Korea | |
|---|---|---|---|
| Household Leverage Ratio | 119% | 89% | 83% |
If we look at this from an economic perspective, the real issue with household debt is how it impacts consumer spending. In economic terms, consumer spending is any discretionary spending on goods and services. This could be gas, groceries, a new laptop or a Netflix subscription. This discretionary spending tends to slow down as household debt grows. This is the result of more household income going to interest payments and less being “left over” at the end of each month other purchases.
This consumer spending trend is not trivial – many economists believe that consumer spending is the single most important factor driving short-term economic performance. Less consumer spend leads to less economic growth for the country and less income growth for consumers.
Trends in Singapore
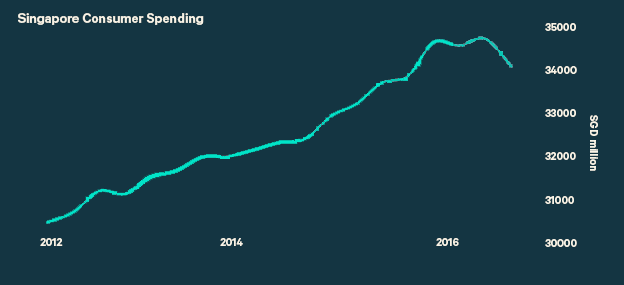
The chart below shows household consumer spending in Singapore since 2012. As debt levels rose between 2012 and 2016, household spending continually expanded. This is likely due to the fact that income growth lagged behind expenditures, thus forcing consumers to borrow to finance their purchases.
In 2016, however, household spending flatlined, and actually started to move lower. This is the first meaningful decline in quarterly consumer spending observed since the 2008 financial crises. The task now for the Monetary Authority of Singapore is to encourage consume spending, without adding on more debt to over-leveraged households.
Looking Forward
The concern now is that this decrease in consumer spending will create a cyclical cooling cycle. This type of economic slowdown can tend to “snowball” in the following way:
- Consumer spending declines
- Economic growth slows
- Wage growth and economic opportunities stall or decline
- Consumers find it harder than ever to pay off their existing debt obligations.
The cycle then repeats itself…
- Consumer spending further declines
- Economic growth continues to slow
- Wage growth and economic opportunities continue to decline
- Consumers have an even harder time paying off their debt obligations.
In recent years, the Monetary Authority of Singapore has taken several steps to minimize the potential fallout from an economic cooling cycle like the one described above. These steps include limitations on new home loans for over-leveraged borrowers and rules meant to prevent “predatory lending”, or loans which are made to consumers which have little chance of paying them back. While these rules may seem limiting to consumers, they are meant to increase long-term stability in the economy by preventing consumers from over-borrowing.
This article was first published at Valuepenguin.sg