By Roy Ngerng and Leong Sze Hian
This is a 10-part series which will analyse the tax that Singaporeans are paying, in comparison with the Nordic countries. It has been said that Singaporeans pay one of the lowest taxes in the world, and that the Nordic countries pay one of the highest taxes in the world. This series would explore this matter in greater depth, and seek to have a better understanding of what the truth really is.
In brief:
- The poorest 20% in Singapore have the lowest share of income in Singapore, as compared to the high-income countries. The richest 20% in Singapore have the highest share of income, and the highest as compared to the high-income countries.
In the Part 1 of this article, we had shown you that for the poor, and for the median-income earner in Singapore, the likelihood of them being able to save, while having to pay the basic necessities, i.e. on food, transport, housing, healthcare and education, would be next to impossible.
Today, we venture further to look into how the disparity really is – what is the share of income in Singapore that the poorest 20% in Singapore have?
For the first question, what proportion of the total income in Singapore do you think the poorest 20% in Singapore have? In a completely equal society, the poorest 20% will have 20% of the income, the poorest 40% would have 40% of the income, and so on. Similarly, the richest 20% would then have 20% of the income – the wealth will be equally distributed.
So, what proportion of income do you think the poorest 20% in Singapore have? 10%, 20% or? And what proportion of income do you think the richest 20% have?
Have that answer in your mind and move on to the next tier, so what proportion of income do you think the poorest 40% in Singapore have? Finally, what proportion of income do you think the poorest 60% have?
Have you tried answering the questions? Let’s take a look at the figures that we have.
For the poorest 20% in Singapore, you might have thought that they would not have 20% of the total income in Singapore, because there is a high income inequality in Singapore. You are right. But do you know that for the poorest 20% in Singapore, they only have a 5% share of the total income in Singapore (Chart 1 based on figures in 1998 by the World Bank Indicator in 2013)?
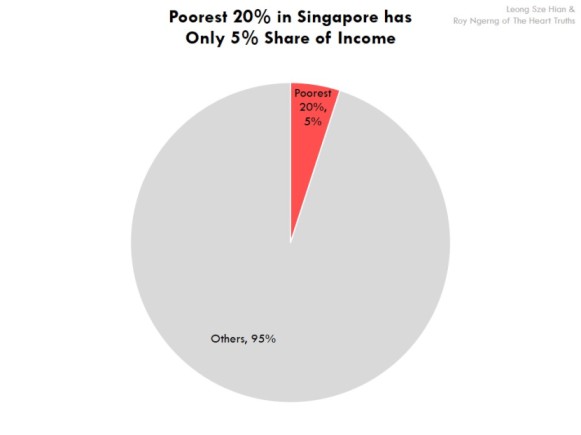
Chart 1: The World Bank World Development Indicators: Distribution of income or consumption
For the richest 20% in Singapore, if you thought that the share of income is high, you are right. The richest 20% actually has a whooping 49% share of income (Chart 2). This means that almost half of all the wealth in Singapore is owned by only 20% of the population.
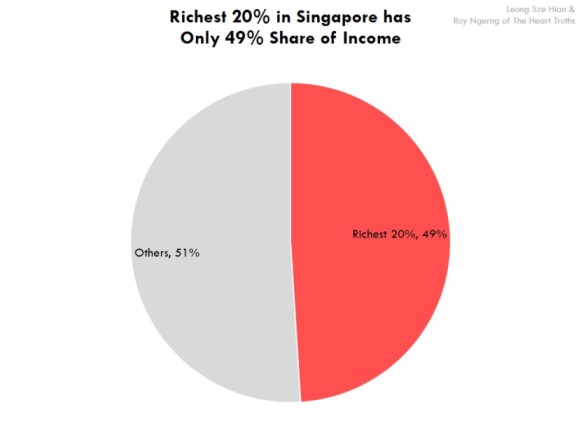
Chart 2: The World Bank World Development Indicators: Distribution of income or consumption
What does that make of the poorest 40% of Singaporeans then? The poorest 40% of Singaporeans aren’t that well-off either – they have only a 14% of the share of income in Singapore (Chart 3).
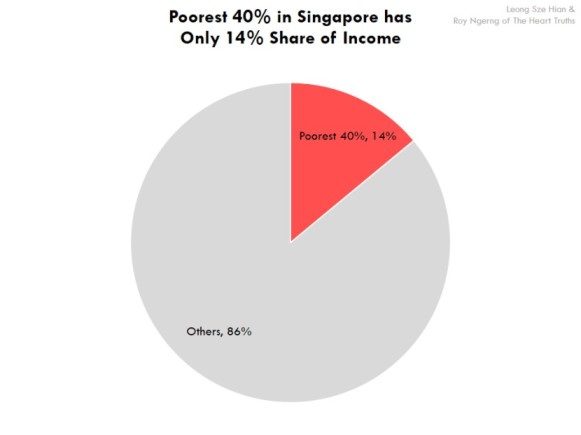
Chart 3: The World Bank World Development Indicators: Distribution of income or consumption
And for the poorest in 60%, they only have 29% of the share of income in Singapore (Chart 4). That’s more than half the population in Singapore, but they have only less than 30% of the income in Singapore!
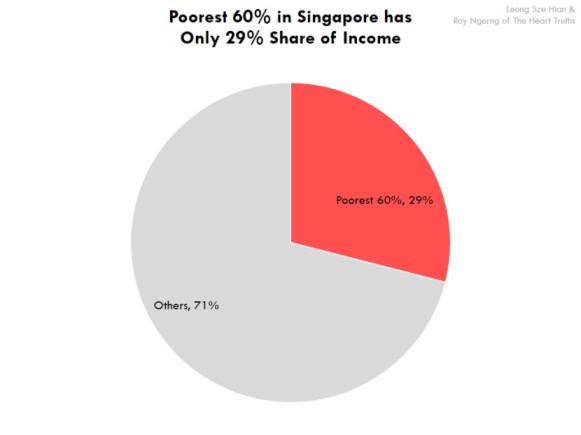
Chart 4: The World Bank World Development Indicators: Distribution of income or consumption
Think back at your answers, and compare them with the actual statistics. How do they compare?
Do you feel shocked? Perhaps, let’s take a further look, by looking at how Singapore compares with the other high-income countries.
When compared to the other high-income countries, the poorest 20% in Singapore are actually the poorest – they have the lowest share of income (Chart 5)!
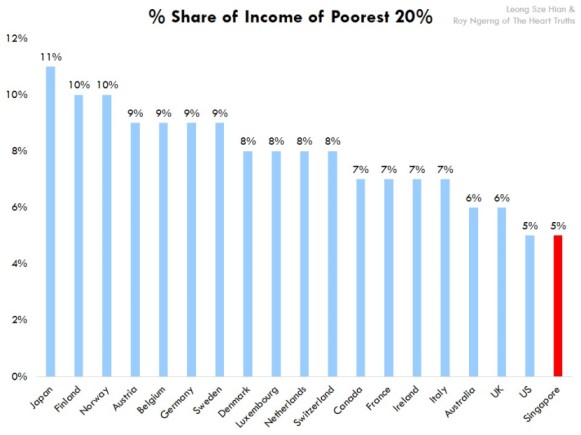
Chart 5: The World Bank World Development Indicators: Distribution of income or consumption
And when we look at the richest 20% in Singapore, they actually have the highest share of income when compared to the other high-income countries (Chart 6)!
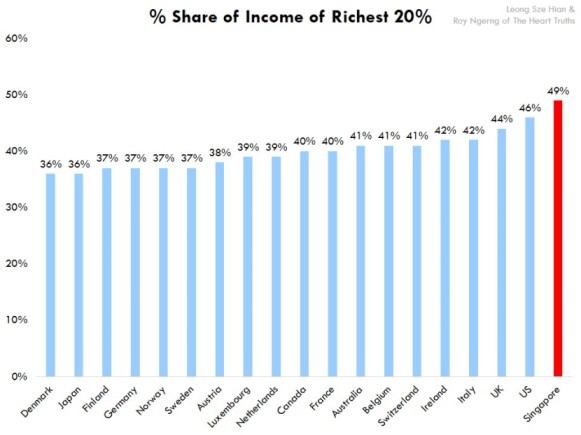
Chart 6: The World Bank World Development Indicators: Distribution of income or consumption
Not only that, for the poorest 60% in Singapore, they also have the lowest share of income among the high-income countries (Chart 7) – the poorest 60% in Singapore, with only a 29% share of income, are the poorest among the high-income countries!
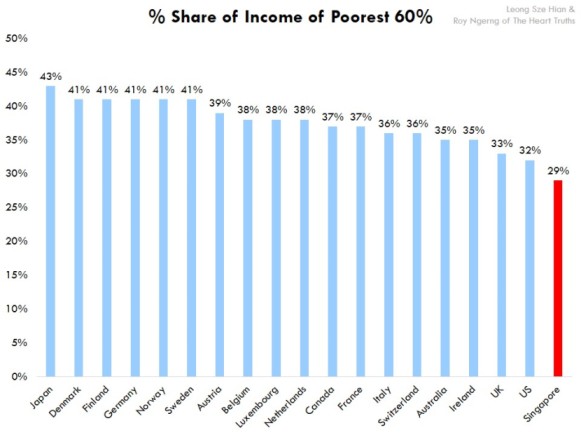
Chart 7: The World Bank World Development Indicators: Distribution of income or consumption
But what if we look at the poorest 80% of Singaporeans? They only have barely half of the income in Singapore – at 51%. And this is the lowest among all the high-income countries as well (Chart 8)! Can you imagine that? 80% of Singaporeans only have half of the income in Singapore?
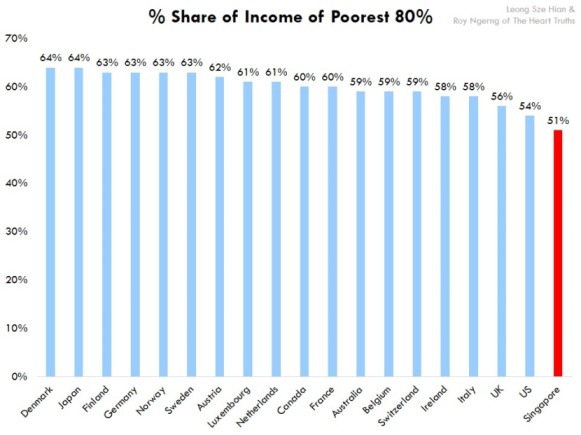
Chart 8: The World Bank World Development Indicators: Distribution of income or consumption
Do you think this is acceptable? But note that the statistics from Singapore are from 1998 – the last year that records of this is publicly available. Since then, inequality has grown even further in Singapore. You can expect that for the richest 20% in Singapore, they would have more than half the income in Singapore, and for the poorest 20% in Singapore, their share of income would have shrunk to below 5%.
But what do you think is the optimum level of the share of income in Singapore? What is the share of income that you think the poorest 20% and richest 20% should have in Singapore?
You see, the Singapore prime minister might say that, “if I can get another 10 billionaires to move to Singapore and set up their base here, my Gini coefficient will get worse but I think Singaporeans will be better off, because they will bring in business, bring in opportunities, open new doors and create new jobs, and I think that is the attitude with which we must approach this problem,” but do you think he is right?
He had also said that, the poor in Singapore are “less badly off than if you were poor nearly anywhere else in the world,” but the statistics have clearly shown otherwise – when compared to the Nordic countries, the poor in Singapore wouldn’t be able to save and would languish into debt, as we had shown in Part 1, whereas their counterparts in the Nordic countries would still be able to save.
At this point, the question we need to ask is – does the government know of this massive in inequality in Singapore? Well, most likely, since the Acting Minister of Culture, Community and Youth had also acknowledged that, “income inequality really started to increase in the late 1990s, after the Asian Financial Crisis”.
However, the data for Singapore published in this article is based on the latest publicly available data from 1998. Data for Singapore since 1998 is not publicly available. As the Acting Minister of Culture, Community and Youth had acknowledged that, “income inequality really started to increase in the late 1990s,”, the disparity in the share of income would have widened since 1998.
Then, the question to ask is – if in 1998, the income inequality was already so large then, that Singapore had already become the most unequal country among the high-income countries by then, then why was there no drastic action to reduce the income inequality then?
Also, since 1998, for 15 years now, the income inequality in Singapore has risen to the highest among all the high-income countries now – if indeed the government would know of this, why did they allow the income inequality to continue to rise?
In the next part of this article, we take a look into the cashflows in our country – the income inequality might be massive in Singapore, but for a long time, we’ve been told that Singapore’s tax rates are low, so Singaporeans should be grateful. Singaporeans should also realise that the government can only do as much since our tax rates are low, so the government has told us. But is this true? Read the next part of our article to find out more.


